Core GRADE 4: rating certainty of evidence—risk of bias, publication bias, and reasons for rating up certainty
BMJ 2025; 389 doi: https://doi.org/10.1136/bmj-2024-083864 (Published 13 May 2025) Cite this as: BMJ 2025;389:e083864
- Gordon Guyatt
 , distinguished professor1 2 3 *,
 - Ying Wang, methodologist4 *,
- Prashanti Eachempati, adjunct professor3 5 6,
- Alfonso Iorio, professor1 2,
- M Hassan Murad, professor7,
- Monica Hultcrantz, head of HTA Region Stockholm8 9,
- Derek K Chu, assistant professor1 2,
- Ivan D Florez, professor10 11 12,
- Lars G Hemkens, professor13 14 15,
- Thomas Agoritsas, professor1 3 16,
- Liang Yao, assistant professor17,
- Per Olav Vandvik, professor3 18,
- Victor M Montori, professor19 20,
- Romina Brignardello-Petersen, associate professor1
- 1Department of Health Research Methods, Evidence and Impact, McMaster University, Hamilton, ON, Canada
- 2Department of Medicine, McMaster University, Hamilton, ON, L8S 4L8, Canada
- 3MAGIC Evidence Ecosystem Foundation, Oslo, Norway
- 4Centre for Evidence-Based Chinese Medicine, Beijing University of Chinese Medicine, Beijing, China
- 5Peninsula Dental School, University of Plymouth, Plymouth, UK
- 6Faculty of Dentistry, Manipal University College Malaysia, Malaysia
- 7Evidence-based Practice Center, Mayo Clinic, Rochester, MN, USA
- 8HTA Region Stockholm, Centre for Health Economics, Informatics and Health Care Research (CHIS), Stockholm Health Care Services, Stockholm, Sweden
- 9Department of Learning, Informatics, Management and Ethics, Karolinska Institutet, Stockholm, Sweden
- 10Department of Pediatrics, University of Antioquia, Medellin, Colombia
- 11Pediatric Intensive Care Unit, Clínica Las Américas-AUNA, Medellin, Colombia
- 12School of Rehabilitation Science, McMaster University, Hamilton, ON, Canada
- 13Pragmatic Evidence Lab, Research Center for Clinical Neuroimmunology and Neuroscience Basel (RC2NB), University Hospital Basel and University of Basel, Basel, Switzerland
- 14Department of Clinical Research, University Hospital Basel and University of Basel, Basel, Switzerland
- 15Meta-Research Innovation Center at Stanford (METRICS), Stanford University, Stanford, CA, USA
- 16Division General Internal Medicine, University Hospitals of Geneva, Geneva, Switzerland
- 17Lee Kong Chian School of Medicine, Nanyang Technological University Singapore, Singapore
- 18Institute of Health and Society, University of Oslo Faculty of Medicine, Oslo, Norway
- 19Division of Endocrinology, Department of Medicine, Mayo Clinic, Rochester, MN, USA
- 20Knowledge and Evaluation Research Unit, Mayo Clinic, Rochester, MN, USA
- *Both authors contributed equally (joint first authors)
- Correspondence to: G Guyatt guyatt{at}mcmaster.ca
- Accepted 21 March 2025
Summary points
To address certainty for risk of bias, Core GRADE users begin by classifying individual studies as overall low or high risk of bias
If high risk of bias studies dominate, Core GRADE users will in most instances rate down certainty of evidence for risk of bias
Substantial evidence from low risk of bias studies with important difference in results from high risk studies mandates using only results from the low risk studies
Substantial evidence from low risk studies with similar results to high risk studies mandates using results from all studies and not rating down for risk of bias
Considering funnel plot asymmetry or statistical approaches and the role of the pharmaceutical industry, Core GRADE users can assess risk of publication bias
Methodologically rigorous non-randomised studies of interventions suggesting a large effect or dose-response gradient mandate consideration of rating up certainty of evidence
This is the fourth paper in a series describing Core GRADE (Grading of Recommendations Assessment, Development and Evaluation), the essentials of the GRADE approach to rating certainty of evidence and grading strength of recommendations in systematic reviews, clinical practice guidelines, and health technology assessments. The previous articles presented an overview of the Core GRADE process and discussed specific aspects of imprecision and inconsistency.123
In Core GRADE’s four category system of high, moderate, low, and very low certainty evidence, randomised controlled trials start as high certainty and non-randomised studies of interventions (NRSI, synonymous with observational studies) start as low certainty. This paper discusses how Core GRADE addresses reasons for rating down the certainty of evidence for risk of bias, publication bias, and reasons for rating up certainty in NRSI.
The information in this article will enable Core GRADE users to understand the definition of risk of bias, choose appropriate instruments for assessing risk of bias of individual studies, rate risk of bias across the body of evidence by considering the relative contribution of low and high risk of bias studies to the pooled estimate and the similarities or differences in their results, understand the causes of and approaches for detecting publication bias, and make appropriate judgments about when to rate up the certainty of evidence from NRSI.
Risk of bias
We define bias as a systematic deviation from the underlying true effect of an intervention on an outcome of interest in a given population. Both randomised controlled trials and NRSI may be subject to limitations in design or execution that can bias the results. Well designed studies will institute safeguards that minimise risk of bias, such as centralised randomisation and blinding. To the extent studies do not implement these safeguards, risk of bias increases. If serious limitations exist among the studies dominating the pooled estimate of effect, Core GRADE users will typically rate down the overall certainty of evidence for risk of bias.
Issues of risk of bias, and thus safeguards against bias, differ between randomised controlled trials and NRSI. We will first deal with randomised controlled trials and then NRSI. The subsequent discussion will address how Core GRADE users should look across the body of evidence to decide whether or not to rate down for risk of bias.
Risk of bias in individual studies
Randomised trials
Although many instruments address risk of bias in parallel group randomised controlled trials,4 a smaller number were designed for general use rather than being tailored to a specific clinical area. These include the Cochrane’s original instrument,5 its revised instrument (RoB 2),6 the instrument developed by the Clinical Advances Through Research and Information Translation (CLARITY) group,7 the Critical Appraisal Skills Programme checklist,8 the Joanna Briggs Institute checklist,9 the National Institute for Health and Care Excellence checklist,10 the Scottish Intercollegiate Guidelines Network checklist,11 and the Risk Of Bias instrument for Use in SysTematic reviews-for Randomised Controlled Trials (ROBUST-RCT) recently developed by an international collaboration of methodologists.12 Although each of these instruments has limitations, the most important is that some include items that in Core GRADE are classified as indirectness and imprecision rather than risk of bias, possibly leading to double counting their impact on the GRADE assessment of the certainty of evidence.4
Box 1 summarises the risk of bias items that randomised controlled trial risk of bias instruments appropriately identify and that Core GRADE users may want to consider.
Risk of bias in randomised trials
Most commonly included and important items across various randomised controlled trial risk of bias tools
Inadequate generation of random allocation sequence
Inadequate concealment of allocation
Not blinding participants
Not blinding healthcare providers
Not blinding data collectors
Not blinding outcome assessors
Not blinding data analysts
Missing outcome data
Less important items variably captured across randomised controlled trial risk of bias tools
Imbalance in co-interventions between groups
Difference in outcome assessment or data collection between groups
Difference in follow-up time, frequency, or intensity of outcome assessment between groups
Deviation from intention-to-treat analysis
Selective outcome reporting
Early termination for benefit
Two rigorously developed instruments that address limitations of their predecessors merit particular consideration. One, Cochrane’s tool for assessing risk of bias in randomised trials, RoB 2,6 offers a clear process for assessing risk of bias in which signalling questions and algorithms reflect the mechanisms by which bias arises.6 RoB 2 includes five domains addressing randomisation, deviations from intended interventions, missing outcome data, outcome measurement, and selective outcome reporting. It is the only formal instrument that explicitly addresses cluster and crossover randomised controlled trials.
This instrument has, however, limitations of complexity and difficulty in application.13 Its sophisticated algorithms and the new terminologies it introduced may contribute to these limitations.1314 Studies have reported low interrater reliability of RoB 2 and challenges in implementation that systematic reviewers sometimes experience.1516
A recently developed instrument, ROBUST-RCT,12 was inspired by the same motivation as this Core GRADE series: to achieve maximal simplicity without sacrificing methodological rigour. Strengths of the new instrument include preparatory systematic surveys of existing instruments4 and of meta-epidemiological studies of risk of bias,17 and extensive pre-testing with both junior and experienced systematic reviewers.
ROBUST-RCT includes six core items addressing random sequence generation, allocation concealment, blinding of participants, blinding of healthcare providers, blinding of outcome assessors, and missing outcome data, as well as eight optional items. The instrument provides two approaches to addressing missing outcome data. The more sophisticated approach, summarised in supplementary appendix 1, involves looking across results from all studies. Those who want to go beyond beyond Core GRADE may consider this approach.
Although the items included in ROBUST-RCT have been widely used in other instruments, experience with the ROBUST-RCT presentation remains limited. Developers of ROBUST-RCT will provide updates about the instrument at https://www.clarityresearch.ca/robust-rct.
Both RoB 2 and ROBUST-RCT suggest that, in some cases, failure to ensure methodological safeguards may not lead to risk of bias (eg, blinding of participants is irrelevant in a trial enrolling neonates). RoB 2 addresses this issue through the signalling questions in algorithms. ROBUST-RCT does so by including two steps for assessing risk of bias: firstly, evaluating whether a methodological safeguard has been implemented (eg, whether participants were blinded) and, secondly, judging risk of bias (eg, whether a lack of blinding actually increased bias).
ROBUST-RCT is well aligned with Core GRADE principles of optimising simplicity and ease of use while maintaining necessary rigour. RoB 2, while less well aligned, includes features that may appeal to some, and particularly to those who want to go beyond Core GRADE. In addition, some Core GRADE users with previous positive experience using one of the other instruments may value familiarity and continue with its use.
Based on the instrument they choose, Core GRADE users will assess the extent of risk of bias associated with each item for each individual study and subsequently rate each study as low or high risk of bias (see section “Risk of bias may differ across outcomes in a study”).
Risk of bias in non-randomised studies
Because of the ubiquitous possibility of prognostic imbalance between intervention and control groups that persists after statistical adjustment (residual confounding), NRSI as a class of study designs begin as low certainty evidence. Failure to include design features within NRSI that minimise bias can result in further rating down to very low certainty of evidence.
Cohort and case-control studies
When, for a particular outcome, randomised trials do not exist or yield only low or very low certainty evidence, Core GRADE users consider using NRSI for assessing the effects of interventions. NRSI include many study designs, of which the most common are cohort and case-control. Cohort studies compare individuals who have received a treatment with those who have not and follow them for the development of the outcomes of interest.1819 Case-control studies identify individuals who have and have not experienced an outcome and then ascertain whether or not they have received the intervention of interest.1920Box 2 presents key risk of bias issues in NRSI.
Risk of bias in non-randomised studies of interventions
Different eligibility criteria or selection of participants between comparison groups such that prognostic factors for outcomes of interest are differentially distributed in intervention and control groups
Inaccurate measurement of interventions
Inappropriate measurement of outcome
Inadequate control of confounders (prognostic factors for outcomes of interest differentially distributed in intervention and control groups):
Inaccurate measurement of confounders
Inadequate adjustment for confounding
Missing outcome data
Selective outcome reporting
A large number of instruments are available for assessing risk of bias in NRSI.212223 Core GRADE users might consider the relatively simple, straightforward, and parsimonious Newcastle-Ottawa quality assessment scale24 or modifications of that instrument for both cohort and case-control studies developed by the CLARITY group.2526
ROBINS-I (Risk Of Bias In Non-randomised Studies-of Interventions) version 127 (and the revised version 228) represents another option for risk of bias assessments in NRSI. Using the revised version of ROBINS-I, reviewers begin by identifying and listing confounding domains relevant to their study question and then decide whether to proceed with a risk of bias assessment by answering signalling questions aimed at identifying studies at critical risk of bias that would not warrant further assessment. Reviewers then assess bias in seven domains addressing from three to 11 signalling questions. Algorithms based on item responses lead to an overall rating for each domain as either low, moderate, serious, or critical risk of bias.
Core GRADE addresses residual confounding by starting the rating of NRSI as low certainty. In contrast, ROBINS-I incorporates the residual confounding into the risk of bias assessment process. Final certainty of evidence ratings with the conventional GRADE approaches and ROBINS-I should align.29
Studies have documented that teams often do not use ROBINS-I version 1 correctly,30 time to complete the instrument is problematic and usability is poor, questions are misunderstood, instructions are unclear, and overall application is demanding.30313233 These experiences suggest that ROBINS-I may not be particularly well aligned with Core GRADE principles. The instrument may nevertheless appeal to GRADE users open to going beyond Core GRADE.
Case series and single arm trials
Case series or single arm trials that include only individuals who receive the intervention of interest and not those who do not represent another type of non-randomised study design in which the certainty of evidence rating starts from low. Because unbiased assessment of intervention effects requires contemporaneous comparisons of treated with untreated individuals, comparisons that are lacking in case series, for such studies one almost always rates down from low to very low. Thus, although an instrument for assessing risk of bias of case series exists,34 such assessment is generally not needed when Core GRADE users assess effects of interventions.35 Results from single arm trials are often compared with external controls, typically historical (eg, comparing survival rates for a new cancer treatment with the survival reported previously with other treatments). Such comparisons are analogous to cohort study designs but do not allow adjusted analysis, and are thus almost always at high risk of bias.
Case series and single arm trials: harms only in intervention group, a special case
Interventions for which harmful effects are restricted to those who receive treatment represent a special case. For instance, only patients who undergo surgery can experience surgical complications. This is also true for other invasive procedures. In these cases, the event rate in the control population is either zero or extremely close to zero. Because of this, a well done single arm study of patients receiving the intervention will provide high certainty evidence of harms that only occur in patients receiving the intervention.
For example, a study using a large administrative database including more than 97 000 individuals who underwent an outpatient colonoscopy identified all those who were admitted to hospital with intestinal bleeding or perforation within 30 days. Because the spontaneous occurrence of such events in any given 30 day period in individuals not undergoing colonoscopy is rare, the study provides an accurate estimate of major complications. Thus, the study provides, for colonoscopy adverse events of bleeding (1.64 per 1000) and perforation (0.85 per 1000), the same low risk of bias estimates as we find in rigorous randomised controlled trials.36
Deciding on low or high risk of bias in individual randomised controlled trials or NRSI
The extent of risk of bias in an individual study represents a continuum from minimal to extremely serious risk of bias. For simplicity, however, Core GRADE users can assess the overall risk of bias in individual studies as low or high. This judgment requires a threshold differentiating the two categories and the acknowledgment of close call situations (fig 1). The arrows in figure 1 are a reminder that risk of bias may be close to a chosen threshold and that close call situations may bear on subsequent decisions.

Judging an individual study as overall high or low risk of bias
For example, consider the outcome of all cause mortality in a randomised controlled trial not using blinding and in which randomisation is concealed, follow-up is complete, and there are no other concerns about risk of bias. The only important source of bias, co-interventions, arises from the lack of blinding of healthcare providers. Core GRADE users must then consider the likelihood of an important co-intervention that may be highly impactful in one context (eg, a heart failure trial with many potent treatments that may be differentially administered to intervention and control groups) versus low in another context (eg, multiple sclerosis, where few potent co-interventions exist and none have shown an impact on mortality). In the first context for the mortality outcome, Core GRADE users would be likely to rate down for risk of bias due to lack of blinding, and, in the second, they would be unlikely to do so. One might consider these and other similar situations as close call decisions about rating down randomised controlled trials for risk of bias.
Moreover, there is no definitive way to establish what the threshold should be for the number of high risk of bias items that merit rating a study as overall high risk of bias. This might be done for only one high risk category or item or require two or even more high risk categories or items to classify a study as high risk of bias. Thus, review teams may—and indeed do—use different thresholds.
For example, in a systematic review of randomised controlled trials addressing the effect of gastrointestinal bleeding prophylaxis with proton pump inhibitors among critically ill patients, the authors used ROBUST-RCT to assess risk of bias.37 Regarding the threshold of overall risk of bias in individual trials, if at least one item was rated as high risk of bias, authors considered the trial as overall high risk of bias. In contrast, the systematic review of cohort studies examining the impact of red and processed meat consumption on cardiometabolic outcomes38 used CLARITY’s modified instrument to rate risk of bias in the included cohort studies and required two or more of the seven items (authors omitted one irrelevant item) rated as high risk of bias to consider the overall risk of bias as high. Finally, in another systematic review evaluating the effect of using an antipsychotic drug on fracture risk,39 for the included cohort studies the authors used CLARITY’s modified instrument to rate their risk of bias and considered a study at overall high risk of bias only if three or more of the eight items were assessed as high risk of bias.
The choice of threshold—high risk of bias in only one or more than one item or category—may be an issue that will be impossible to resolve: how often does risk of bias actually result in bias? We do not know the answer and are unlikely ever to know. Moreover, the answer is likely to be context specific. Rating down a study for a single item or for two items assessed as high risk of bias would be reasonable; any more would be questionable. Explicit statement of the threshold choice, as well as the rationale, increases transparency.
Risk of bias may differ across outcomes in a study
Different outcomes from the same study may be at different risk of bias. For instance, risk of bias due to missing outcome data may be higher for an outcome that is difficult to follow for a long period (eg, quality of life) than for an outcome that is easy to follow (eg, survival). The same is true for risk of bias due to not blinding of outcome assessors: the impact of not blinding on risk of bias may differ across subjective (higher risk) versus objective (lower risk) outcomes.17 Blinding of outcome assessors is particularly irrelevant for all cause mortality—for instance, authors of one systematic review noted, “Most of the included trials did not blind the outcome assessors; however, mortality can be ascertained without risk of bias.”40
A systematic review evaluating the effect of red and processed meat intake on cardiometabolic and cancer outcomes provides an example of different risk of bias judgments across outcomes in a single study.41 Considering that risk of bias may differ for all cause mortality, cardiometabolic outcomes, and cancer, authors assessed risk of bias separately for each outcome for each included cohort study. Because prognostic factors differed across outcomes, the authors concluded that the risk of bias also differed.
In most systematic reviews, however, authors typically report a figure or table with risk of bias assessments for each study without distinguishing between outcomes. Although one might infer that in such instances authors considered the extent of risk of bias to be similar for each outcome, they may have failed to consider the possibility of different risk of bias across outcomes.Thus, an explicit statement from Core GRADE users that they did consider the issue and either concluded risk similar for all outcomes, or report separately for different outcomes, would be ideal.
Rating risk of bias across bodies of evidence
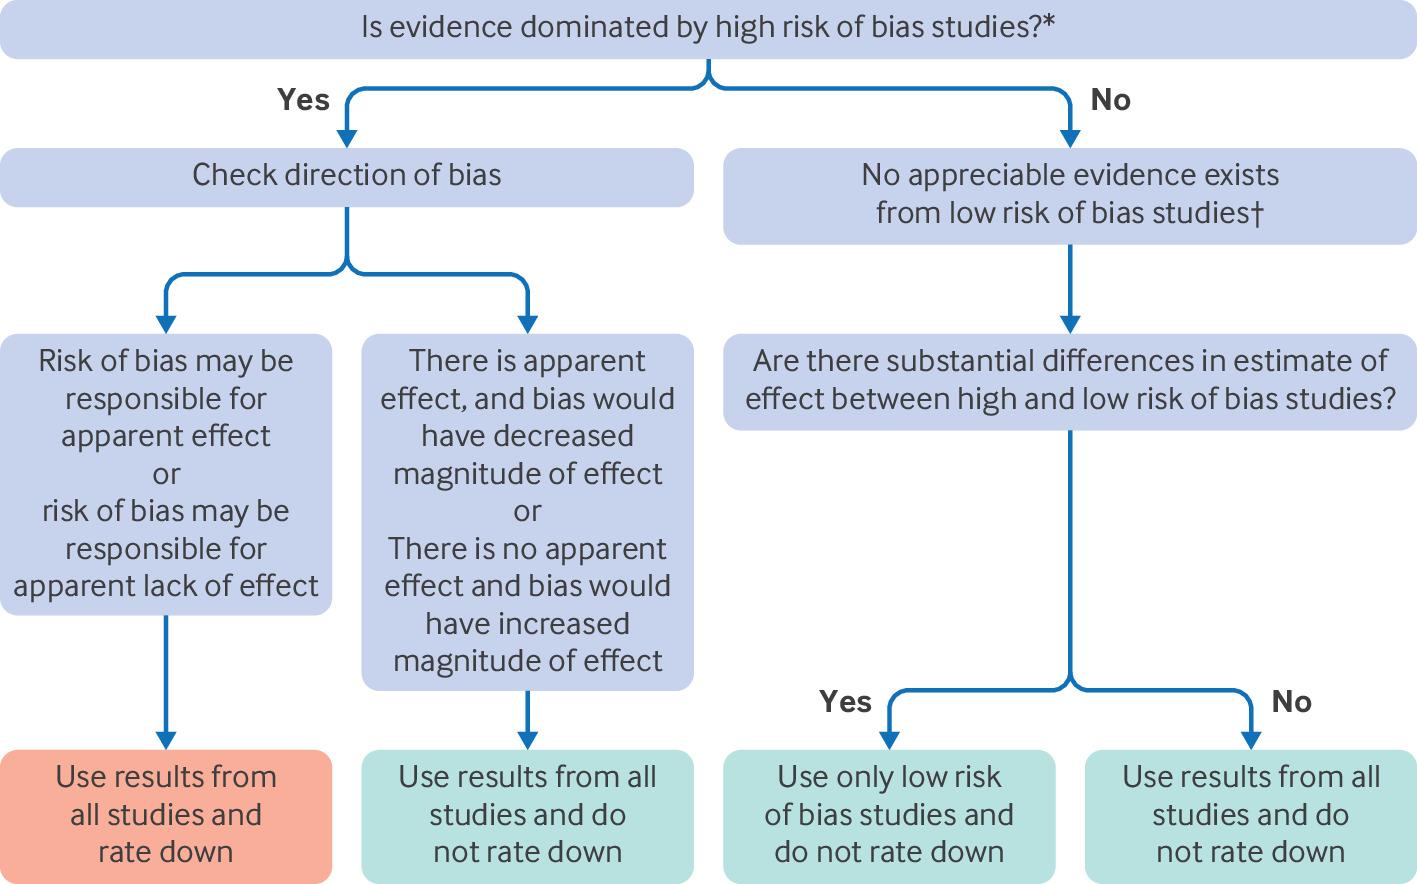
The ultimate goal of assessing risk of bias in individual studies is to inform whether to rate down the certainty of evidence across the entire body of evidence. In addressing risk of bias across all studies, Core GRADE users should follow the steps summarised in figure 2. The flow chart applies to both randomised controlled trials that will start as overall high certainty evidence and NRSI that will start as low certainty evidence. For NRSI, the rating down for risk of bias refers to moving from low to very low certainty evidence.

Flow chart depicting process of considering rating of low or high risk of bias in individual studies to arrive at decision of whether to rate down certainty of evidence for risk of bias. *Possible thresholds for high risk of bias “dominating”: >65% weight or ≥55% weight=possibly dominating. †Possible thresholds for appreciable low risk of bias evidence, corresponding to thresholds for high risk of bias dominating, ≥35% or ≥45% weight
Firstly, systematic reviewers need to determine if high risk of bias studies dominate the body of evidence—that is, they carry substantially more weight than low risk of bias studies. If that is the case, Core GRADE users should pool results from all studies and rate down the certainty of evidence for risk of bias. Before doing so they should consider the possible direction of bias which, as we describe in the next section “Considering direction of bias,” may obviate the need for rating down. We would conclude that high risk of bias studies dominate considering possible thresholds of weight in the meta-analysis of >65% or ≥55% of the weight.
For example, a systematic review compared the addition of azithromycin to scaling and root planing versus not adding azithromycin in patients with chronic periodontitis.42 For bleeding on probing within three months, of the four relevant trials the only low risk of bias trial enrolled only 28 patients and reported a mean difference in proportion of sites that bled of 5.43. The 95% confidence interval (CI) was very wide (−8.96 to 19.82), including substantial benefit but also large harm and the study carried 15% of the weight in the analysis. The authors therefore included both the single low and the three high risk of bias trials that carried 85% of the weight and calculated a pooled estimate of −6.65 (95% CI −10.41 to −2.89), indicating benefit of azithromycin. Because of the dominant evience from the high risk of bias studies and the corresponding sparse evidence from the single low risk of bias trial, after considering direction of bias the authors appropriately rated certainty down for risk of bias.
Another example comes from a systematic review comparing child feeding interventions with no intervention in children aged 5 years and younger.43 The meta-analysis of 15 trials with 1976 participants suggested increased vegetable consumption in the child feeding intervention group (standardised mean difference 0.44, 95% CI 0.24 to 0.65). Reviewers rated 10 trials with 1469 participants and 69% of the weight at high risk of bias. Thus, after considering direction of bias, the authors used the pooled estimate to make inferences and rated the certainty of evidence down for risk of bias.
In contrast, when appreciable evidence from low risk of bias studies exists, with reasonable thresholds for appreciable being ≥35 to ≥45% of the weight in the pooled analysis, Core GRADE users should consider, for each outcome of interest, whether low and high risk of bias studies suggest similar or substantially different magnitudes of effect. This inquiry should, if point estimates differ appreciably, include formal tests of subgroup differences between trials, acknowledging that such tests are often underpowered when there are only few trials.
If low and high risk of bias studies suggest substantially different intervention effects, Core GRADE users will base inferences on only the low risk of bias studies as their best estimate of effect and not rate the certainty down for risk of bias.
For example, a systematic review investigating the effect of corticosteroid treatment for patients admitted to hospital with community acquired pneumonia addressed the outcome of duration of stay in hospital.44 The investigators judged three trials with 1288 patients at low risk of bias and six trials with 359 patients at high risk of bias (low risk of bias studies carried 69% of the weight). The authors conducted subgroup analysis based on risk of bias and found very different estimates from low risk of bias trials (mean difference −1.00 day, 95% CI −1.79 to −0.21) and high risk of bias studies (mean difference −4.41 days, 95% CI −7.65 to −1.17); (P=0.045 for interaction). Thus, the authors based their inferences only on low risk of bias trials and did not rate down certainty for risk of bias.
If results are not importantly different in low and high risk of bias studies, Core GRADE users will include all studies in generating their best estimate of intervention effects and not rate the certainty down for risk of bias. The reason: risk of bias is just that—a risk that in a particular instance may or may not actually create bias. Investigators may fail to conceal randomisation, fail to blind, or lose large numbers of patients to follow-up and still generate minimally biased results. Thus, if low and high risk of bias studies suggest similar results, one can reasonably infer that the high risk of bias studies have provided minimally biased estimates, use results from all studies, and not rated down the certainty of evidence for risk of bias.
For example, a systematic review of randomised controlled trials compared the effect of human or bovine colostrum with placebo in preterm infants.45 For the outcome time to reach full feed, four studies with 131 participants proved at low risk of bias and two studies with 154 participants proved at high risk. Low and high risk of bias studies suggested similar results (low risk of bias studies carried 54% of weight: weighted mean difference −4.19 days, 95% CI −9.40 to 1.03; high risk of bias studies carried 46% of weight: −3.47 days, −9.06 to 2.13); (P=0.85 for interaction). Thus, reviewers used the results from all studies as the best effect estimate (−3.55 days, −6.77 to −0.33) and did not rate down certainty of evidence for risk of bias.
Considering direction of bias
Core GRADE users should also consider the expected direction of any bias influencing results. If, in studies showing no important difference in effect, bias would have increased differences between groups, one can infer that the actual difference must be, if different at all, smaller than it appreared. Consideration of risk of bias would thus reinforce the conclusion of no difference between groups and consequently there would be no reason to rate down for risk of bias. Similarly, if effects in studies show a difference but bias would have decreased that difference, the inference would be that the true relative effect is if anything larger than that observed. There would therefore be no reason to rate down for risk of bias.
Consider for instance a meta-analysis of randomised controlled trials addressing the prevention of Plasmodium falciparum malaria transmission that compared the addition of primaquine to a previous regimen versus not adding the drug.46 Results provided evidence that primaquine reduced, rather than increased, adverse events (odds ratio 0.79, 95% CI 0.63 to 1.42). Lack of blinding suggested classifying the studies at high risk of bias. However, if clinicians know that a patient is receiving an additional drug, they would be more inclined to attribute symptoms to side effects from the drug than in patients not receiving the drug. If they were blinded, there could be no such differential attribution. Thus, bias from failure to blind would have led to an overestimation of adverse events with primaquine. Considering this, the direction of bias increases our strength of inference that primaquine does not importantly increase adverse effects. Thus, review authors appropriately decided against rating down for risk of bias.
Publication bias
Publication bias refers to the bias in the pooled estimate of effect that results from failure to publish studies based on their results—typically studies with negative findings.47 Analyses of trials registered with institutional review boards have shown selective non-publication of studies with negative or statistically non-significant results.4849 The effect has proved greater in NRSI than randomised trials.5051
At least three causes are associated with selective non-publication of studies with negative results. Firstly, authors may fail to submit studies for publication because of a perception that journals will consider negative results uninteresting. Secondly, journal editors and their peer reviewers may indeed find negative results uninteresting and reject manuscripts on that basis. Thirdly, for commercially funded studies, it is in the interest of funders motivated to maximise use of their product to suppress negative results and thus create an impression of larger than actual beneficial effects.
Commercial funding
In one example of selective publication by manufacturers, a systematic review examining the effect of reboxetine on acute treatment of major depression retrieved both published trials from databases and unpublished data from the manufacturer of reboxetine.52 Results showed that published data overestimated the benefit of reboxetine by as much as 115% compared with placebo and 23% compared with selective serotonin reuptake inhibitors.
In another example, a study investigated 74 antidepressant trials registered by the Food and Drug Administration (FDA) and found selective publication based on results.53 The FDA deemed results from 38 studies as positive, of which 37 were published. Among the 36 trials with results deemed as negative or questionable, 22 were not published and 11 were published as positive.
Another study analysed 400 randomly selected trials registered on ClinicalTrials.gov for their public disclosure of results.54 Overall, 118 trials (29.5%) failed to make their results public within four years of completion. Commercially funded trials (adjusted hazard ratio 0.49, 95% CI 0.36 to 0.66) were less likely to be published or were published later.
In all these examples, authors had access to the results of unpublished studies, established they provided much less sanguine results, and thus had definitive evidence of publication bias. Reviewers may be aware that eligible studies exist, but results may be unavailable. If that is the case, and the sample size of those studies is large enough to impact substantially on overall results, reviewers should rate down for publication bias.
Reviewers may rate down for publication bias even when they have not identified specific unpublished studies. Because of the concern about the impact of industry sponsorship on selective publication, Core GRADE users should consider rating down for publication bias when the available studies are all small and industry sponsors have conducted most or all of the studies. For instance, a systematic review of flavonoids in patients with haemorrhoids that found large relative risk reductions in bleeding and pain identified 11 studies ranging in size from 40 to 234 participants all of which were industry sponsored.55
Avoiding publication bias: comprehensive search
Consideration of publication bias creates a unique problem for Core GRADE users: one is guessing at the presence of something that one cannot document. Systematic reviews with a less than comprehensive search may not locate studies published in non-indexed or non-English journals, or studies in registries (eg, clinicalTrials.gov) or regulatory databases (eg, FDA and European Medicines Agency),56 thus raising the possibility of conducting searches from these sources. For example, a systematic review of leukotriene receptor antagonists for chronic urticaria identified 24 out of 34 relevant randomised controlled trials in Chinese.57
Nevertheless, the likely low yield precludes the necessity of such searches in all or even most cases. Searches may, however, be desirable in some instances, such as in Chinese databases when conducting a systematic review of traditional Chinese medicine. Even a comprehensive search will not, however, detect studies with a delay to publication, that were never submitted, or that do not appear in any study registries.58
Suspecting publication bias: funnel plots and statistical tests
Core GRADE users can assess risk of publication bias by visually inspecting the funnel plot—a scatter plot in which each dot represents a study included in the meta-analysis. The horizontal axis shows the magnitude of effect estimate of the individual studies (eg, log odds ratio, mean difference) and the vertical axis shows precision of the estimate of effect (eg, inverse of standard error, sample size).59
In a funnel plot, larger studies with more precise results are displayed at the apex, and because they are more precise should be closer to the pooled estimate of effect. Smaller studies with lower precision scatter more widely at the bottom and should be symmetrically distributed around the pooled effect estimate. Thus, distribution of the dots should resemble a symmetrical inverted funnel (top panel in fig 3).

(Top) Funnel plot not suggestive of publication bias. (Bottom) Funnel plot suggestive of publication bias
If the funnel plot is asymmetrical with a missing quadrant of small studies with negative results, publication bias represents a plausible explanation (bottom panel in fig 3). However, other explanations include small studies being biased in favour of the intervention, or small studies more faithfully following the intervention and thus achieving more favourable results. Given these alternative explanations we sometimes refer to such asymmetrical funnel plots as showing small study effects.
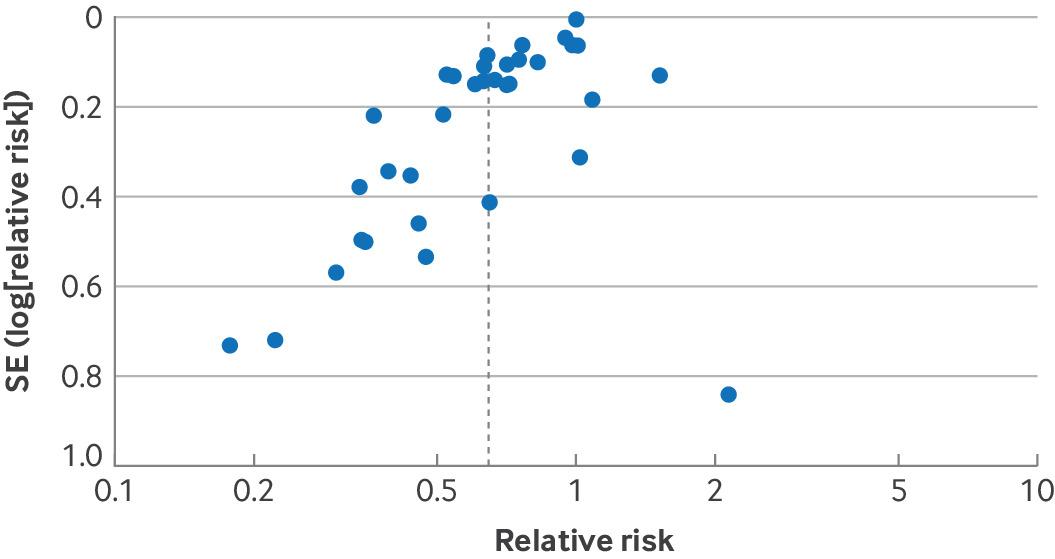
Figure 4 presents an example of funnel plot asymmetry from a systematic review investigating the effects of probiotics on risk of acute infectious diarrhoea lasting ≥48 hours.60 Here, several small studies favour probiotics to a greater extent than the large studies but only one small study is less favourable than the large studies. Such a result warrants serious consideration of rating down for publication bias.

Funnel plot from a systematic review investigating effects of probiotics on acute infectious diarrhoea suggested high risk of publication bias. SE=standard error
Using funnel plots to test publication bias does, however, have limitiations. Visual inspection of asymmetry involves subjectivity that is prone to error.61 Statistical approaches to test the asymmetry of funnel plots, including Egger’s regression test,62 Begg’s rank test,63 and a variety of other tests 64656667 are available but have been criticised for both false negative rates and false positive rates.4768 The use of statistical tests requires a meta-analysis including ≥10 studies, also preferable for making inferences about funnel plot asymmetry.69
Because of the limitations of the approaches for assessing publication bias, Core GRADE users will often be left with uncertainty. Core GRADE therefore suggests using the terms undetected (when no evidence suggests publication bias and they thus do not rate down certainty, the usual situation) and strongly suspected (when evidence suggesting publication bias exists and they do rate down certainty) to describe the publication bias domain.58
Figure 5 shows the steps Core GRADE users can follow to decide whether to rate down certainty of evidence for publication bias.

Flow chart depicting process of deciding whether to rate down certainty of evidence for publication bias. FDA=Food and Drug Administration
Selective outcome reporting
One type of selective outcome reporting occurs when the results for an outcome of interest in some studies are unfavourable and consequently the investigators do not report the results. In such instances, these studies do not contribute to the meta-analysis for that outcome. One can suspect selective outcome reporting when outcomes specified in the study protocol are not reported in the final publication, or one anticipates certain outcomes that authors omit in study publication while they report less critical ones. Since the funnel plot and test for funnel plot asymmetry can detect this problem, it is addressed in the publication bias domain.
Another type of selective outcome reporting can occur when studies report the results for the outcome of interest but the reported result is selected from multiple available effect estimates (eg, multiple time points, multiple outcome measurement methods, or multiple analytical approaches) or the the outcome measurement is inconsistent between the protocol and the publication report. NRSI, in which pre-registered protocols are far less likely to prespecify which of the possible results will be included in the analysis, require special attention since reporting bias may be enormous.7071 This type of selective outcome reporting should be addressed as risk of bias in individual studies rather than publication bias.
Rating up certainty of evidence
Although NRSI start out as low certainty evidence, it is possible to rate up certainty derived from NRSI to moderate or even high certainty. We will now review the two situations when Core GRADE users might rate up certainty: large magnitude of effect and dose-response gradient.
Large magnitude of effect
As we have described, in the Core GRADE approach NRSI start out as low certainty and may then be rated down for risk of bias issues particular to NRSI designs. When NRSI were not rated down from low to very low (ie, no risk of bias limitations particular to NRSI designs, and sufficiently precise to exclude values less extreme than chosen thresholds), Core GRADE users will consider whether they show large effects. If they do observe large effects, Core GRADE users will consider rating up the certainty of evidence using the following thresholds: relative risk >2.0 or <0.5 (similar thresholds for odds ratio and hazard ratio), consider rating up one level; when relative risk is >5.0 or <0.2, consider rating up two levels.72 The rationale for this guidance is that modelling studies have shown that the likelihood of confounders that could explain a relative risk >2.0 or <0.5 is low and the likelihood of confounders that could explain a relative risk >5.0 or <0.2 is very low.73
For example, a systematic review of observational studies examining the association between infant sleeping position and sudden infant death syndrome found an odds ratio of 4.46 (95% CI 2.98 to 6.68) of sudden infant death syndrome occurring with front versus back sleeping positions.74 Such an association would warrant rating up certainty by one level.
Other factors may strengthen the case for rating up. These include rapidity of onset (eg, insulin for diabetic ketoacidosis, and adrenaline (epinephrine) to treat anaphylaxis) and a relentless downhill trajectory without intervention (eg, hip replacement for severe hip osteoarthritis).7275
Finally, there may be situations in which patients always or almost always did badly before and do so much better with a new intervention that no one has thought it worthwhile to conduct a formal observational study addressing the issue. Examples include resuscitation after cardiac arrest, insulin in diabetic ketoacidosis, adrenaline in anaphylactic shock, dialysis in terminal renal failure, and volume repletion in patients with evident volume depletion.
Dose-response gradient
The term dose-response gradient describes an observation that incremental increases (or decreases) of the dose or magnitude of the intervention produce incremental increases (or decreases) in the effect. For example, a meta-analysis of salvage radiotherapy after radical prostatectomy found that each 1 gray increase in the dose of radiotherapy is associated with a 2% increase in relapse-free survival.76 This dose-response gradient increases our certainty that a causal connection between the intervention and the outcome exists.
There are, however, risks in rating up for a dose-response gradient if the putative causal intervention is not actually causal but is linked to another intervention or situation that is causal.77 For example, several case-control studies showed a dose-response gradient between coffee consumption and pancreatic cancer.7879 As it turned out, the actual cause was not coffee but smoking, which does cause pancreatic cancer and for which a true dose-response gradient has been found (the more an individual smokes, the higher the likelihood of pancreatic cancer).8081 The apparent dose-response gradient for coffee was a result of an association between smoking and coffee consumption: smokers drank more coffee, and the more they smoked, the more coffee they drank.8283 If Core GRADE users suspect such confounding between causal and non-causal associations, they will not rate up certainty for dose-response.77
Supplementary appendix 2 presents an alternative conceptualisation of the rating up process in which studies with large or very large effects and/or a credible dose-response gradient begin at moderate or high certainty evidence.
Conclusion
Core GRADE users will, in considering risk of bias, start by assessing individual studies as being at low or high risk of bias. When considering all studies together to decide whether to rate down certainty of evidence for risk of bias, Core GRADE users will first consider the relative contribution of high and low risk of bias studies. If high risk of bias studies dominate the evidence and bias may be responsible for the observed effect or lack of effect, Core GRADE users will rate down the certainty of evidence for risk of bias. If appreciable evidence exists from low risk of bias studies, Core GRADE users will determine whether low and high risk of bias studies suggest substantially different effects: if that proves the case, they will use only the results from low risk of bias studies and not rate down the certainty of evidence for risk of bias; if not, they will use the pooled results from all studies and again not rate down.
Although all approaches to addressing publication bias have limitations, considering funnel plots or statistical approaches for testing funnel plot asymmetry may be of use. A body of evidence consisting of relatively small studies funded by industry should raise suspicion. When magnitude of effect is large or very large or a credible dose-response gradient exists and the risk of bias is overall deemed low, one can consider rating up certainty of evidence from NRSI.
Footnotes
Contributors: GG and YW contributed equally and are joint first authors. GG, VMM, TA, MH, and AI conceived and designed the Core GRADE series. GG, YW, PE, AI, and MHM drafted this article. GG and YW are the guarantors. All authors critically revised the article across several iterations for important intellectual content and gave final approval for the article. The corresponding author attests that all listed authors meet authorship criteria and that no others meeting the criteria have been omitted.
Funding: No external funding.
Competing interests: All authors have completed the ICMJE uniform disclosure form at www.icmje.org/disclosure-of-interest/ and declare: no support from any organisation for the submitted work; no financial relationships with any organisations that might have an interest in the submitted work in the previous three years; no other relationships or activities that could appear to have influenced the submitted work.
Provenance and peer review: Not commissioned; externally peer reviewed.